I recently helped a colleague identify ridges from a Digital Elevation Model (DEM). They were interested in knowing where ridges were located, because their species of interest usually moves around the landscape using ridges. I assume this strategy is either an avoidance or predatory behavior or a mix of both. Or, its just easier to cross a landscape by using ridges. In any case, I found an ArcGIS related post on stackoverflow that did exactly what I wanted to do, so I decided to reproduce this same methodology in R. In the following example I used a DEM for Switzerland. I mostly use standard R functions in the raster package. Some of these plots were made with the rasterVis package.
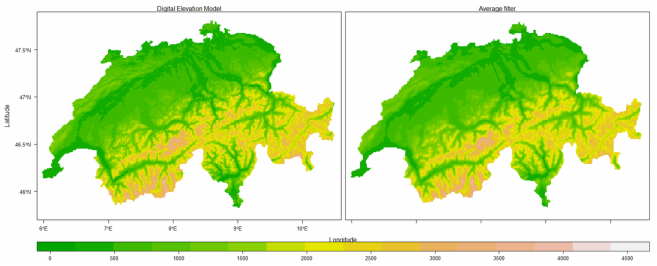
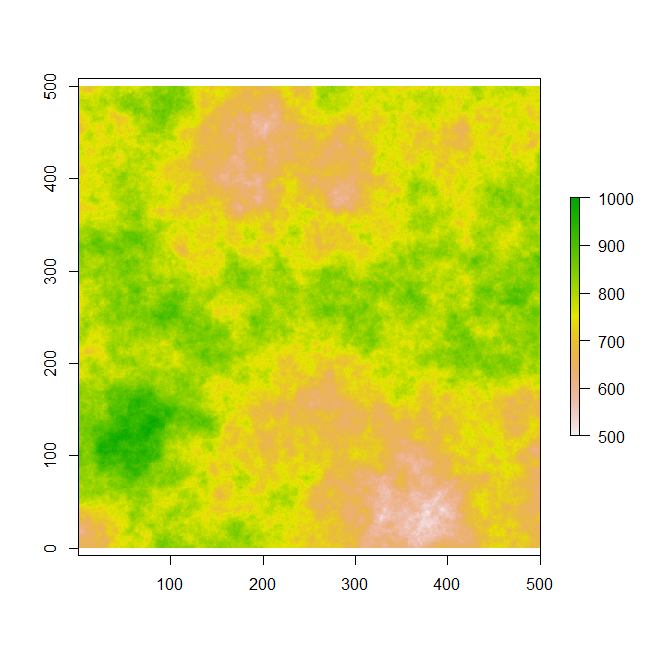
To begin we need to take the DEM and compute a mean filter on the data. Basically for each pixel a neighborhood statistic is calculated (e.g. mean, max min etc.). However, we need to first define the neighborhood. I decided to use a neighborhood of 3 by 3 pixels. The Switzerland DEM has a pixel resolution of 0.008333 degrees, this is about 1 km^2. Not exactly 1 km^2, but 928 by 1360 meters or 1.3 km^2. This means that for every pixel, R will calculate the average elevation of a 9 km^2 neighborhood. Essential this ends up smoothing out the DEM.
To begin we need to take the DEM and compute a mean filter on the data. Basically for each pixel a neighborhood statistic is calculated (e.g. mean, max min etc.). However, we need to first define the neighborhood. I decided to use a neighborhood of 3 by 3 pixels. The Switzerland DEM has a pixel resolution of 0.008333 degrees, this is about 1 km^2. Not exactly 1 km^2, but 928 by 1360 meters or 1.3 km^2. This means that for every pixel, R will calculate the average elevation of a 9 km^2 neighborhood. Essential this ends up smoothing out the DEM.
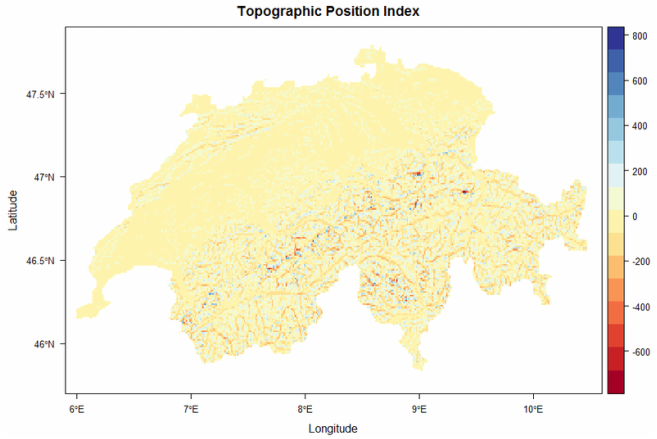
Now that we calculated the mean focal statistic of our DEM we need to deduct the original DEM's elevations by the average focal statistic. The product is the elevation difference of each pixel from its neighborhood. These values are called the Topographic Position Index (TPI; De Reu et al. 2013). A positive value means that the pixel has an elevation higher than its 9 km^2 neighborhood and a negative means its lower. If you want you can calculate the TPI directly with the terrain function in the raster package.
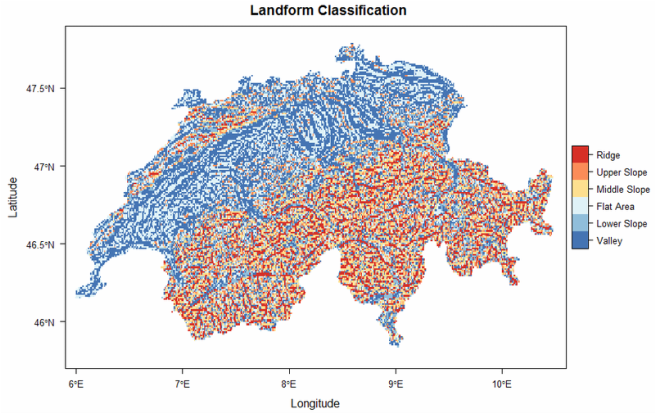
With the TPI we can now classify the landscape using the De Reu et al. (2013) method that was adapted from Weiss (2001).
- Ridges Zo > SD
- Upper Slope SD >= Zo > SD/2
- Middle Slope SD/2 >= Zo >= 0
- Flat Area 0 > Zo >= -SD/2
- Lower Slope -SD/2 > Zo >= -SD
- Valley Z0 < - SD
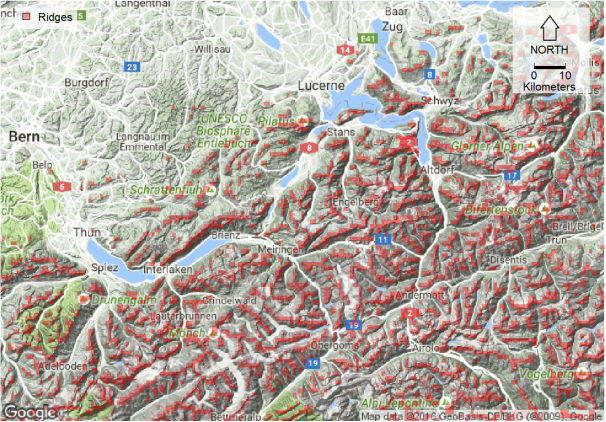
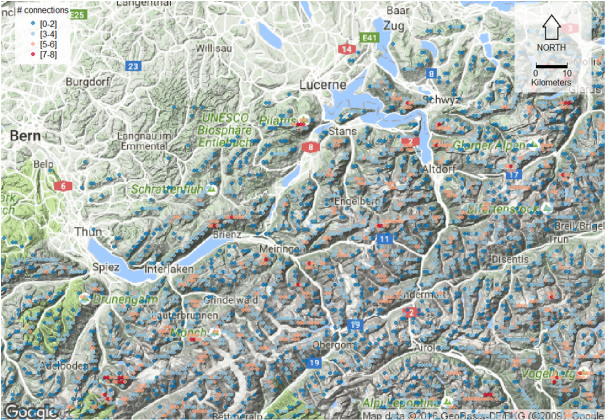
Now that we have our ridges and other landforms, we want to overlay them on to a map to check whether it makes any sense. So I decided to use the gmap function from the dismo package. I used the Google terrain map and overlayed my ridges raster on to it. It seems that the red areas that I classified as ridges do end up on ridges and peaks!
Now that we have the locations of ridges and peaks we can get a rough idea how our species of interest is moving between these locations by creating a neighborhood network. In this example, I assume that my species of interest will not distance its self for more than 2 km from these ridges. I simply used the rasterToPoint function to turn the ridges into nodes and then I used the dnearneigh function from the spdep package to create a large spatial graph. Using this graph I calculate the number of links between each node. This gives me a coarse measure of connectivity.
If you are interested in reproducing this work with your own landscape, I added the code below. You'll just need to change the "dem" place holder to your own raster.
References
De Reu, J., Bourgeois, J., Bats, M., Zwertvaegher, A., Gelorini, V., De Smedt, P., Chu, W., Antrop, M., De Maeyer, P., Finke, P. and Van Meirvenne, M., 2013. Application of the topographic position index to heterogeneous landscapes. Geomorphology, 186, pp.39-49.
Weiss, A., 2001, July. Topographic position and landforms analysis. InPoster presentation, ESRI user conference, San Diego, CA (Vol. 200).
Weiss, A., 2001, July. Topographic position and landforms analysis. InPoster presentation, ESRI user conference, San Diego, CA (Vol. 200).
 RSS Feed
